
Figure 2.
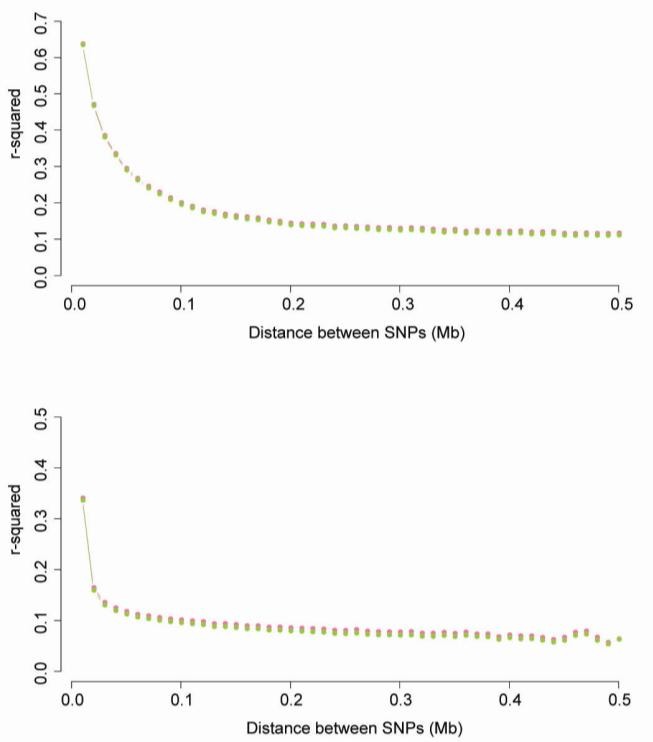
Average linkage disequilibrium (solid line) plotted against the median of the distance bin range (Mb). Each hot pink and yellow-green color represents the existing r2 and the r2 corrected by the genomic relationship structure based on SNP, respectively. (a) Distances ranged from 0 to 0.5 Mb. r2 values were averaged using bins of 0.01 Mb and pooled over autosomes. (b) Distances ranged from 0 to 5 Mb. r2 values were averaged using bins of 0.1 Mb and pooled over autosomes.