
Figure 5.
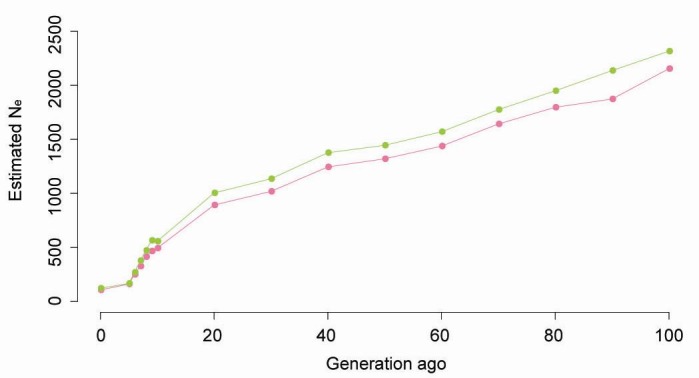
Average estimated effective population size plotted against generations in the past, truncated at 100 generations. Each hot pink and yellow-green color dot represents the use of the existing r2 and the r2 corrected by the genomic relationship structure based on SNP, respectively.