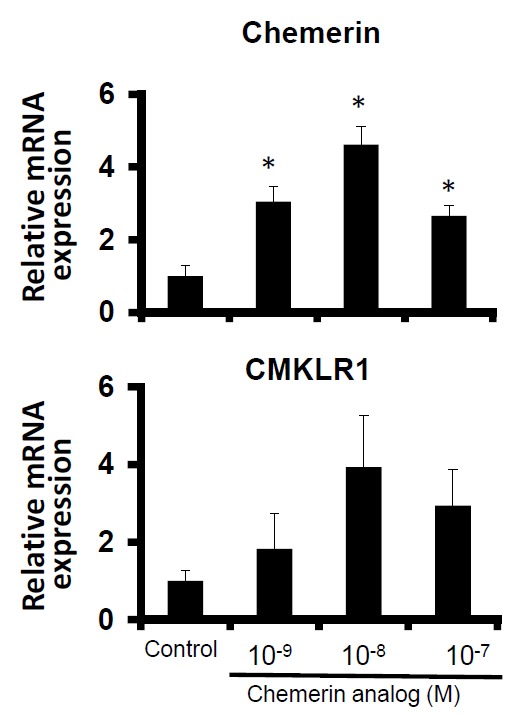
Figure 3.

Gene expression levels of chemerin and CMKLR1 in bovine differentiated adipocytes treated with chemerin analog (10−9, 10−8 and 10−7 M). The data are shown as means±SEM and represent data collected from at least three experiments. The data were normalized with 18s rRNA and shown as means±SEM in relative to the levels of control cells (* p<0.05 vs control).
