
Figure 3.
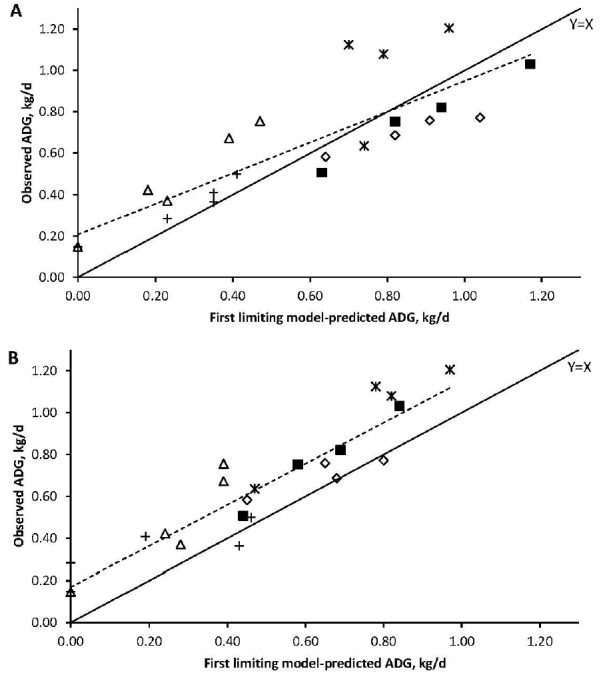
Relationships between observed and first-limiting model-predicted average daily gain (ADG) using level 1 (A) or level 2 (B) solutions of the Large Ruminant Nutrition System. Symbols are studies 1 (⋄), 2 (■), 3 (A), 4 (+), and 5 (✳). Solid line is the Y = X and the dotted line is the linear regression.