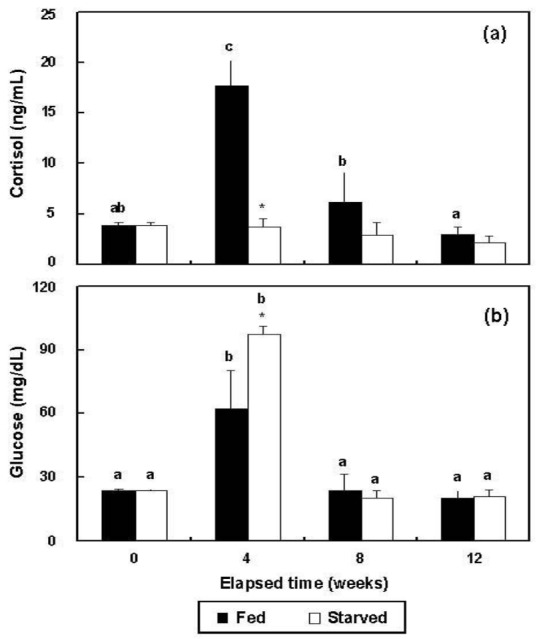
Figure 4.

Variations during triplicate experiments in (a) cortisol and (b) glucose levels in the plasma of the fed and starved groups of olive flounder, Paralichthys olivaceus (n = 10). The same letters on the same-colored bars indicate no significant difference (p>0.05).
*Indicates significant differences between the two groups at equivalent weeks.
