
Figure 1.
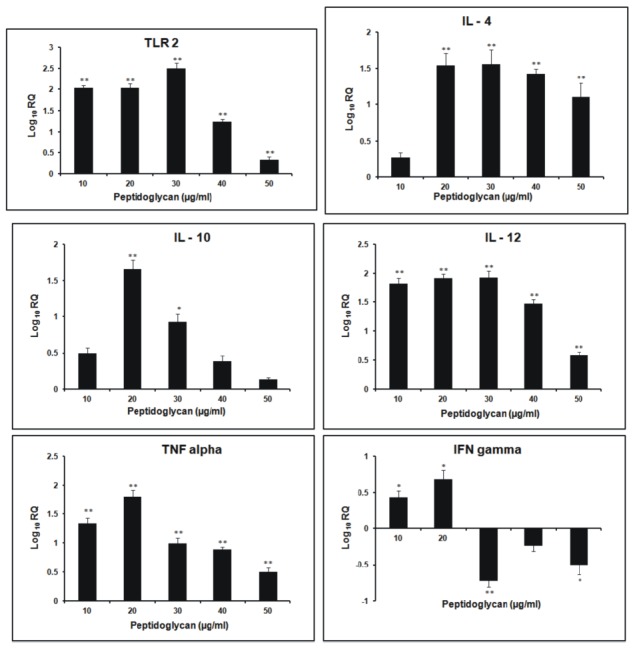
qPCR of TLR2, IL-12, TNF-α, IFN-γ, IL-10 and IL-4 genes after stimulation with B. subtilis peptidoglycan for 3 h. Results shown as fold change (log 10 relative quantification (RQ)) relative to the control group. The data are the means and SEM. * p<0.05 and ** p<0.01.