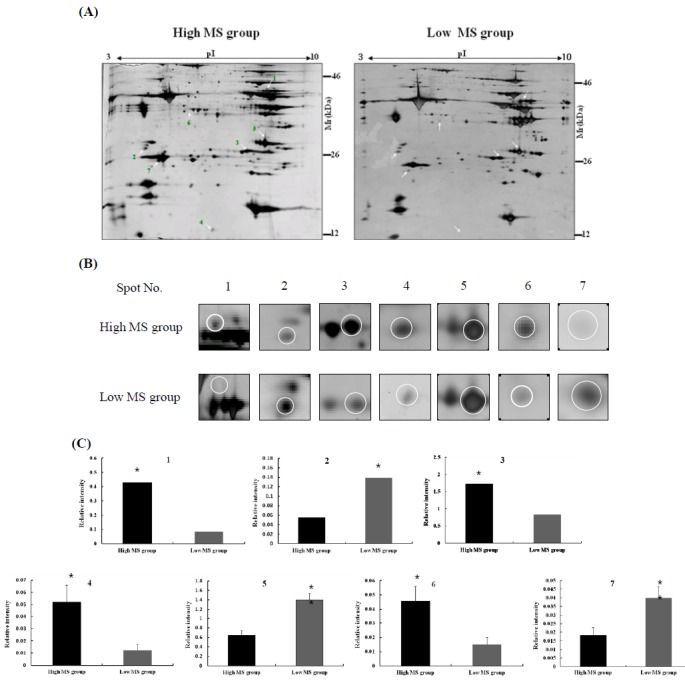
Figure 1.

2-DE images of bovine longissimus dorsi muscle. (A) Protein patterns of bovine sirloin taken from high and low marbling score (MS) groups. One hundred μg of protein extracts were separated by 2-DE and stained with a silver staining kit. Spots corresponding to differently expressed proteins are indicated by arrows. (B) The magnified fields of the 2-DE images showing differences in protein expression patterns between the high and low MS groups. (C) Quantification of differentially expressed proteins in bovine muscle. Student’s t-test was performed to compare protein expression patterns between the high and low MS groups (n = 20, * p<0.05; ** p<0.01).
