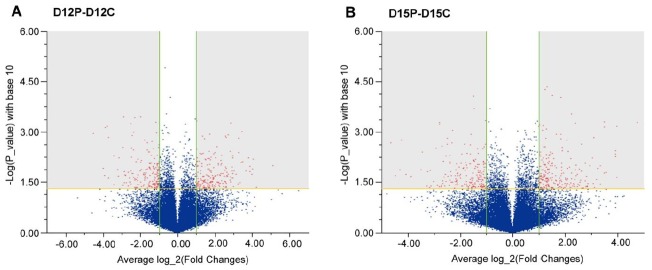
Figure 1.

Volcano plot images for the comparative analysis of endometrial gene expression on day (D) 12 of pregnancy to D12 of the estrous cycle (A) and on D15 of pregnancy to D15 of the estrous cycle (B) in pigs. The X axis represents the average log_2 (fold-change), and the Y axis represents the -log (p-value) with base 10. Location in the upper left shaded area implies down-regulation; location in the upper right shaded area implies up-regulation. Cutoff values were below p<0.05 (horizontal line) and above an average two-fold change (vertical lines).
