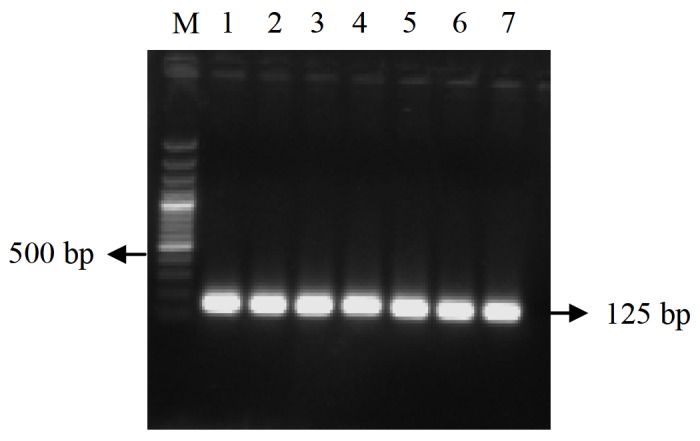
Figure 4.

EF1-α expression throughout the time period. Lane M: 100 bp plus marker, lane 1–7: h post injection, 0, 3, 6, 12, 24, 48 and 72 h.p.i, respectively.

EF1-α expression throughout the time period. Lane M: 100 bp plus marker, lane 1–7: h post injection, 0, 3, 6, 12, 24, 48 and 72 h.p.i, respectively.