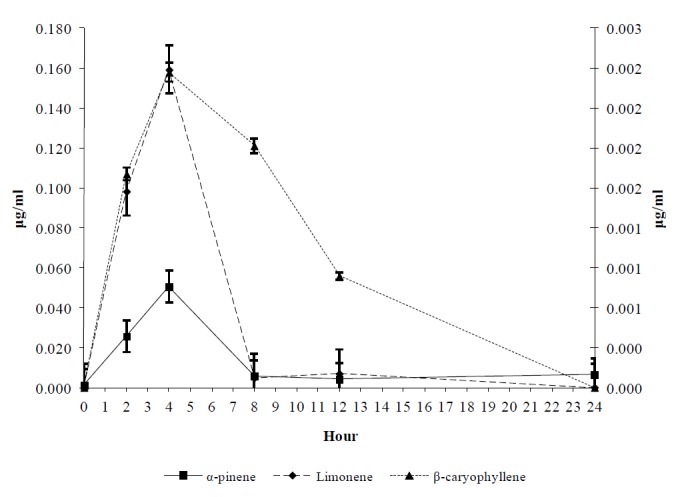
Figure 1.

Mean α-pinene, limonene and β-caryophyllene concentration (µg/ml) for the first 24 h in goats’ blood plasma receiving 1g/head/d of each substance. The primary axis is the concentration in µg/ml of α-pinene and limonene and the secondary axis is the concentration in µg/ml of β-caryophyllene. Bars on each mean represent standard errors of mean values.
