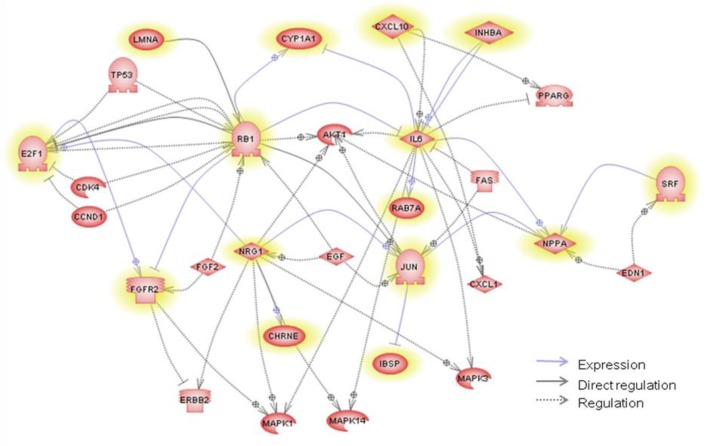
Figure 3.
Pathway analysis generated by Pathway studio applied to genes in the red module related to marbling score. The network contains common regulators as well as common targets for the group of direct-interacted genes in order to examine their possible roles. The yellow-highlighted denotes genes in the red module.

