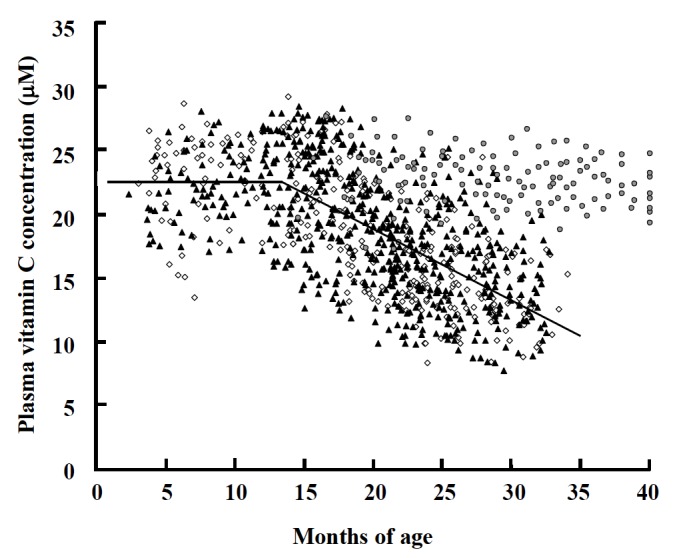
Figure 4.

Relationship between plasma vitamin C concentrations and age in beef cattle. Female calves and heifers (⋄), castrated male calves and steers (▲), and replacement heifers and dry cows (
 ). The regression lines were evaluated using the Non Linear Regression Procedure of SAS in all cattle except for replacement heifers and dry cows; Y (μM) = 22.5 when X (mo) ≤13.4; Y (μM) = −0.556X (mo) +29.9 when X (mo) ≥13.4, p<0.0001.
