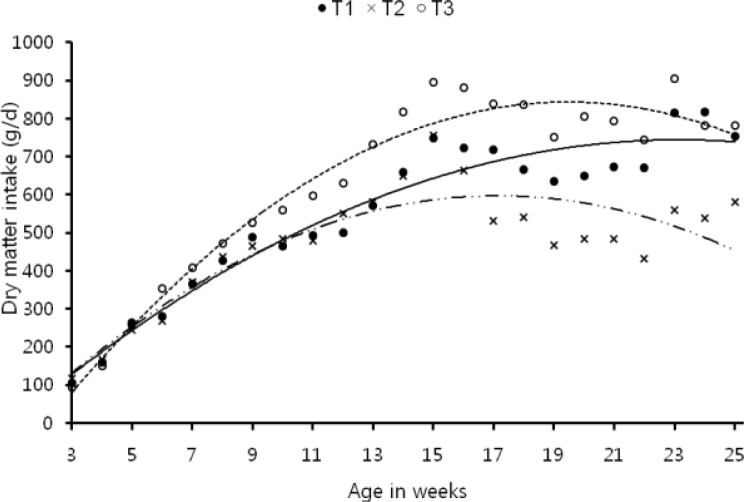
Figure 1.
Pattern of daily dry matter intake during different weeks in different treatments. T1 -•- (control): y = −1.516x2+70.25x−69.4 (R2 = 0.933). T2 -··×-·· (control+40 g rice bran oil/kg): y = −2.329x2+79.88x−87.57 (R2 = 0.779). T3 ··○·· (control+ca-soap of rice bran oil 40 g/kg): y = −2.815x2+109.6x−223.2 (R2 = 0.956).

