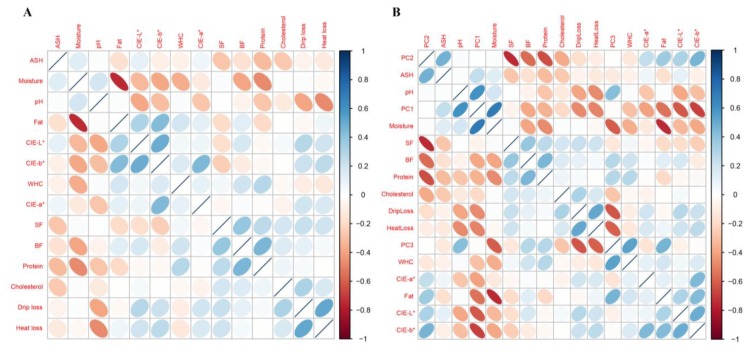
Figure 1.
Pairwise phenotypic correlations between traits. A) Showing 14 meat traits: Ash, moisture, meat pH24, fat (intramuscular fat content), meat colour (CIE-L*, CIE-a*, CIE-b*), WHC (water holding capacity), SF (shear force), back fat thickness (BF), protein, cholesterol, drip loss, heat loss. B) Here the three PCs were added to the results of the PCA, and the 14 phenotypes along with PC1, PC2, and PC3 are shown. The phenotypic correlations between traits in similar phenotypes are stronger than others. The correlation values are represented as colours, where range of colours (from red to blue) shows the range of correlation values. The blue colour represents positive correlation between the phenotypes, the red colour means negative correlation between the phenotypes. The order was determined by hierarchical clustering method.

