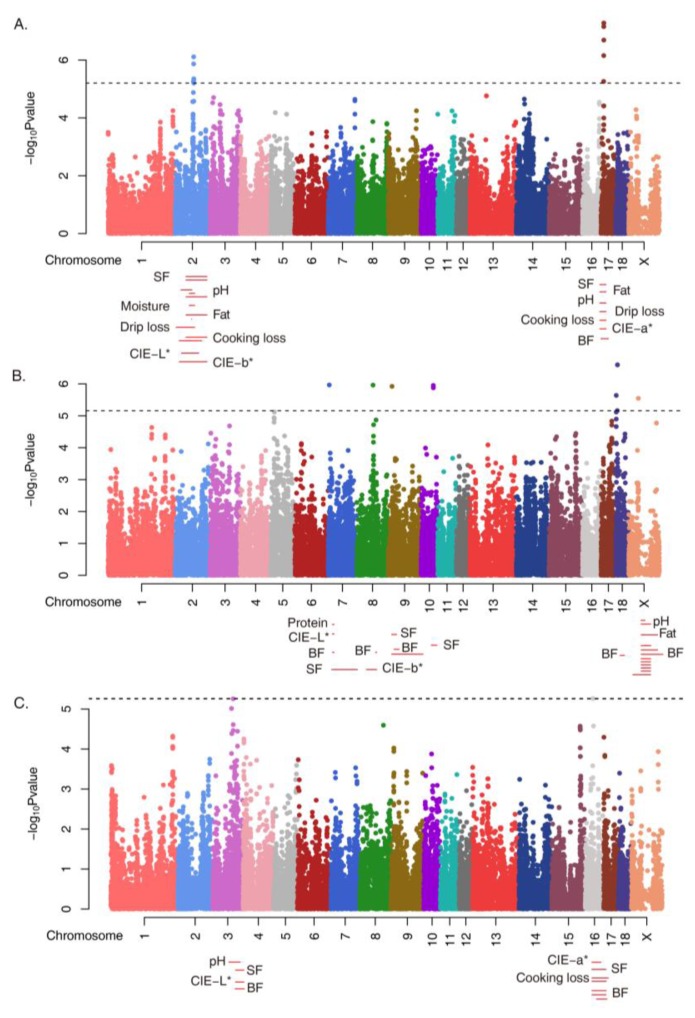
Figure 2.
Manhattan plots of GWAS results for the traits and QTL mapping. GWAS for the integrated phenotypes using illumina Porcine 60K SNP BeadChip of 181 Duroc samples. Each panel A), B) and C) show GWAS results against residual of PC1, PC2, and PC3. The x-axis of the Manhattan plot shows the genomic position, the y-axis represents the log10 base transformed p-values, LD-adjusted Bonferroni significance levels (7.2E-06) was applied. Meat-quality-related QTL regions located in significant SNPs are shown.

