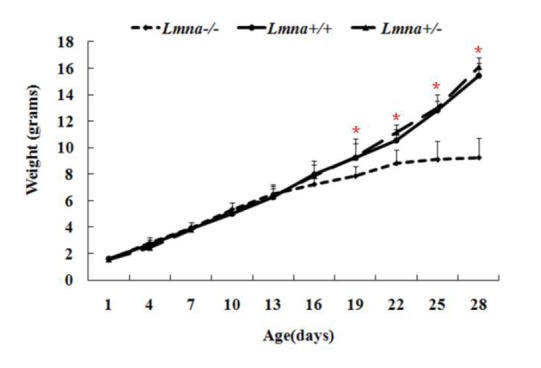
Figure 2.

Growth curves of mice with different Lmna genotypes. The body weights of Lmna−/−, Lmna+/+ and Lmna+/− mice were evaluated once every 3 days from their birth (D1) to 4 weeks (D28). The data are presented as the mean±SD, n = 30. The black solid line denotes wild-type mice. The long dashed line denotes Lmna+/− mice. The short dashed line indicates Lmna−/− mice. * p<0.05.
