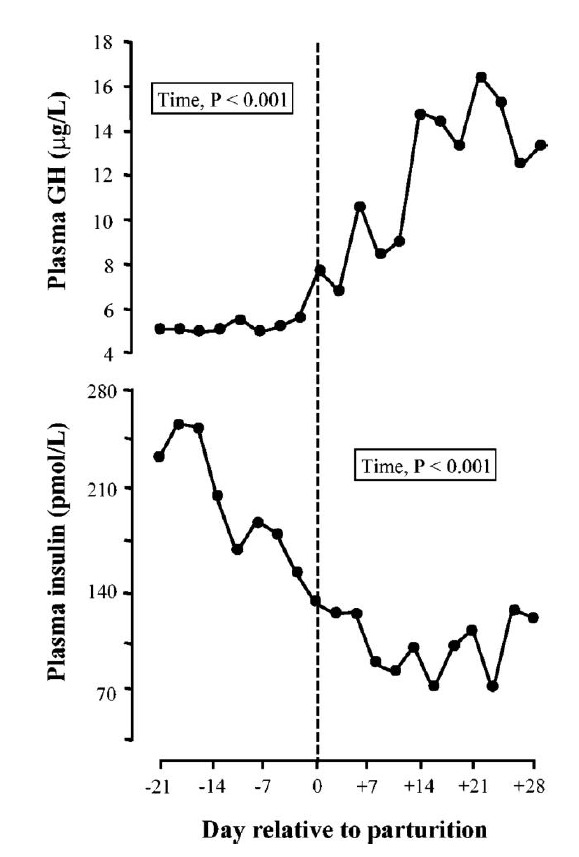
Figure 2.

Profiles of plasma GH and insulin during the transition from pregnancy to lactation in multiparous dairy cows. Cows (n = 9) were studied in the period from d 21 prepartum to d 8 postpartum. The day of parturition is denoted by the dashed vertical line (adapted from Rhoads et al., 2004).
