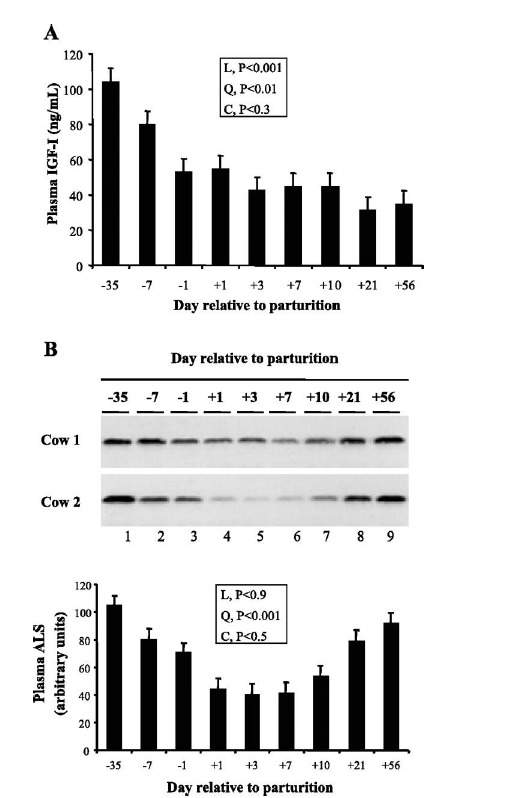
Figure 4.

Profile of plasma ALS abundance during the periparturient period. Four multiparous dairy cows were studied during the period between day −35 and +56. (A) Plasma IGF-I concentration was measured by RIA. (B) Plasma ALs was measured by western blotting. The effect of time was partitioned into linear (L), quadratic (Q) and cubic (C) contrasts (adapted from Kim et al., 2006).
