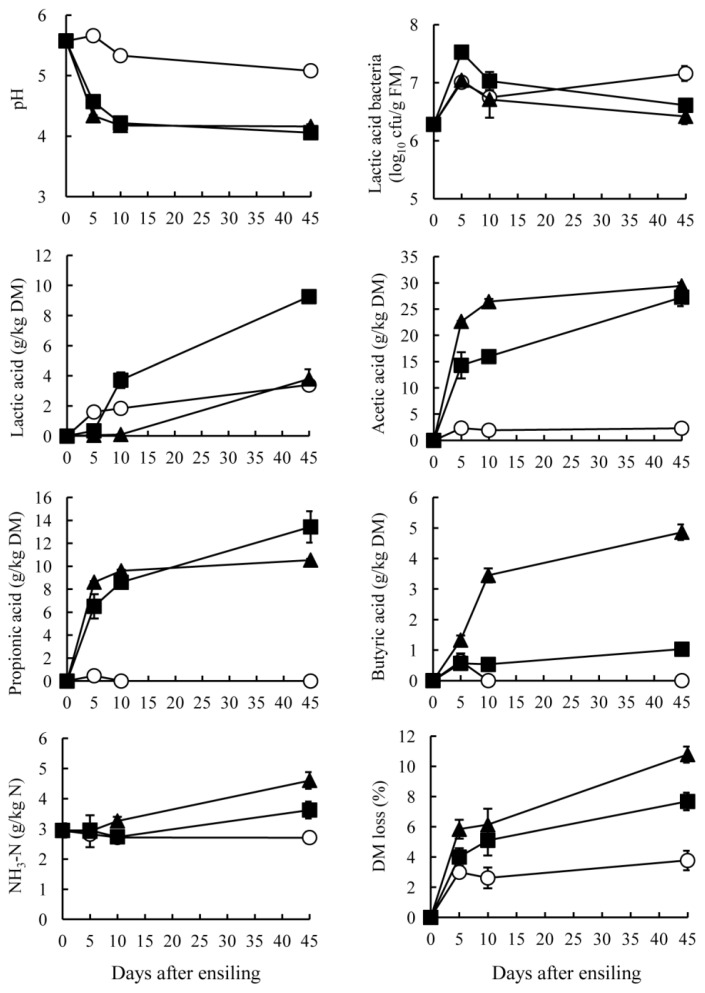
Figure 1.
Changes in pH, numbers of lactic acid bacteria, fermented products, and DM loss of green tea by-product silage ensiled at 10°C (○), 20°C (■) and 30°C (▲). Data were collected on 0, 5, 10, and 45 days after ensiling. Points indicate mean values of triplicates silos with standard errors represented by vertical bars.

