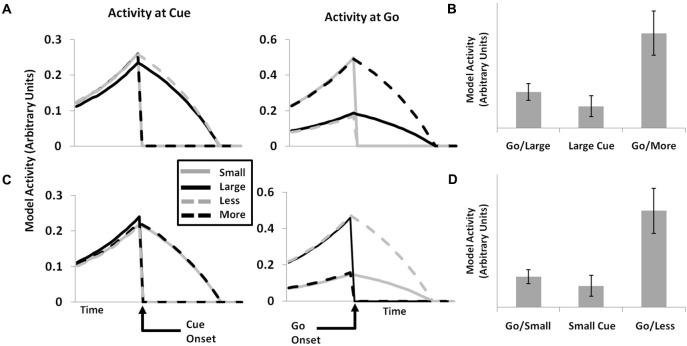
Figure 5.
Single-unit data (cf. Sallet et al., 2007, Figure 7). The activity of single units in the PRO model corresponds with data showing populations of neurons within ACC whose activity appears to code for LARGE (A and B) or SMALL (C and D) reward magnitudes. When presented with an initial cue indicating either reward magnitude (left panels), a subset of individual units remain active while the activity of other units falls to 0. Following a second GO cue (center panels), individual units appear to indicate surprising gains or losses, as would be the case when a LARGE reward is initially cued, followed by a second cue indicating a SMALL reward (top panels), and vice versa (bottom panels). Model activity is greater for GO cues than for initial cues when the reward magnitude indicated by the two cues is consistent (right panels), while activity is maximal for GO cues which are inconsistent with initial cues, either indicating a greater or lesser reward.

