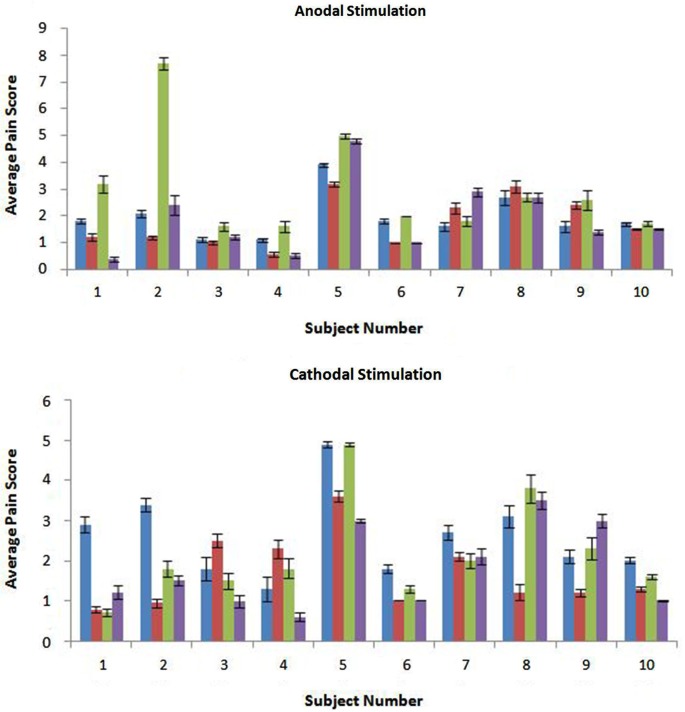
Figure 1.
The anodal and cathodal scores are shown with the average for each subject and error bars are representative of standard error. From left to right the conditions shown are: CCNY-4/No Pretreatment (in blue), CCNY-4/Pretreatment (in red), Lectron/No Pretreatment (in green), and Lectron/Pretreatment (in purple). There was a significant difference between the control and pretreatment groups (p = 0.0157).

