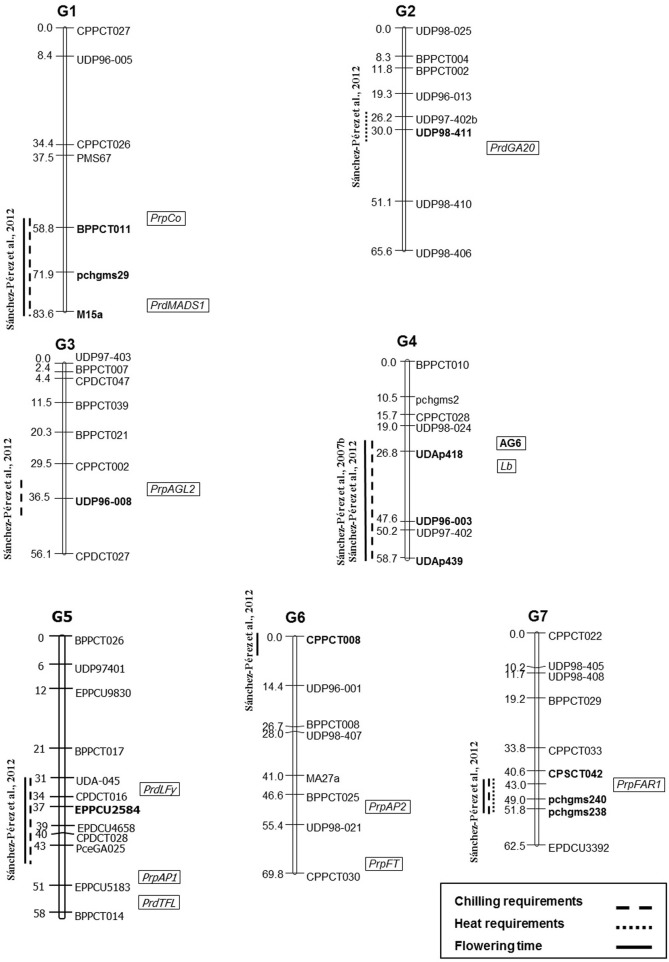
Figure 1.
Location of QTLs linked to flowering time and chilling and heat requirements in the almond map from the population R1000 × Desmayo Largueta performed by Sánchez-Pérez et al. (2007b, 2012). The closest SSR marker linked to the QTL is marked with bold lettering on this map. The approximately location of the RAPD marker (AG6) (Ballester et al., 2001) and candidate genes (in italics) (Silva et al., 2005) linked to flowering time in other almond populations, are indicated inside the boxes. The integration of this information from different genetic maps has been performed using the centimorgan (cM) distances indicated by the different authors in each linkage group and each map.

