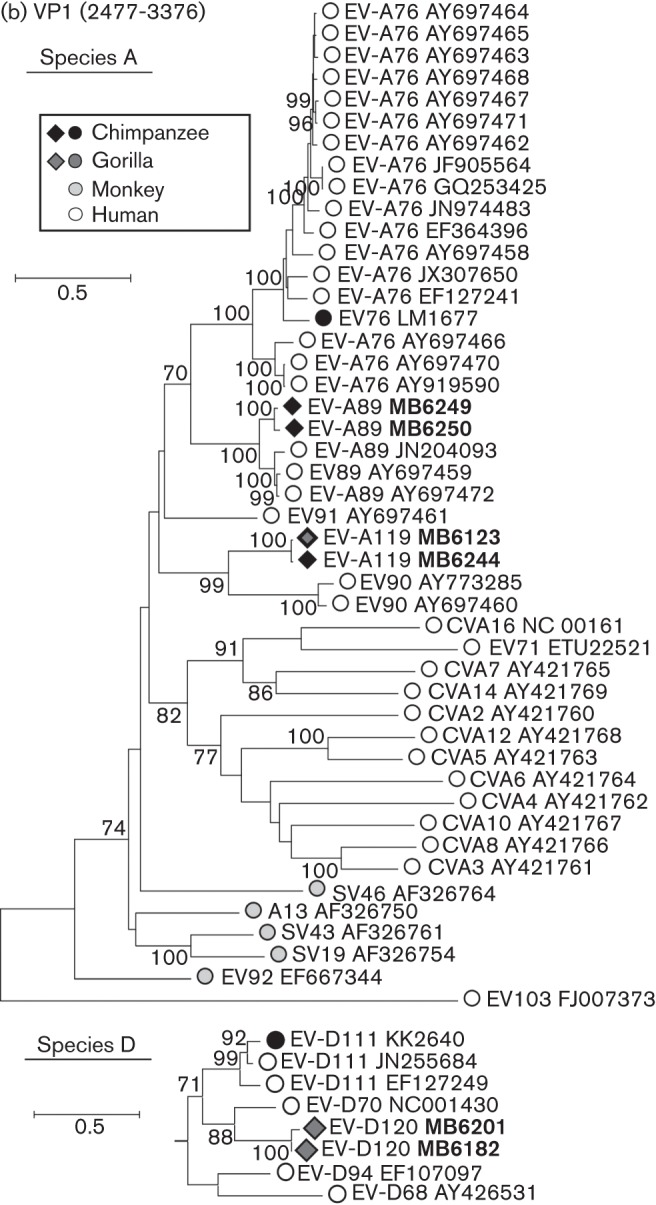
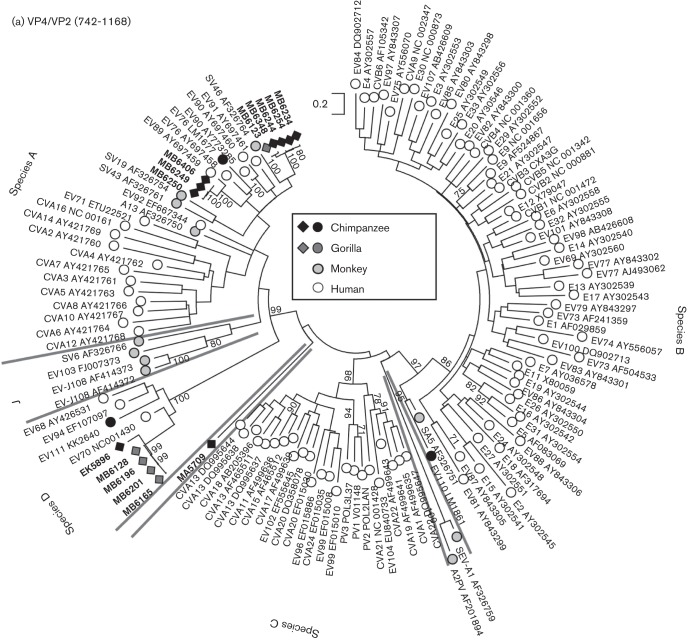
Fig. 2.

(a) Maximum-likelihood analysis (TN+G+I model) of the VP4 region (positions 742–1168 numbered using the PV3 reference sequence) of sequences amplified from infected chimpanzees and gorillas from the current study (black and medium grey filled diamonds, labelled in bold). MA5709 was obtained from a bonobo and does not group with any currently described EV species. These were compared with previously published sequences from these primates (black and medium grey filled circles) and from monkey species (light grey-filled symbols). Single, representative sequences of human enterovirus types are shown as unfilled circles. Lineages dividing EV types into species are identified by grey lines with species labelled on the periphery. Bootstrap resampling of ML trees was performed to indicate robustness of grouping (values of >70 % shown). (b) Rooted maximum-likelihood trees of the whole VP1 region (positions 2477–3376) of species A (TN+G+I model, EV103–FJ007373 as outgroup) and species D (HKY+G+I model, EV71–ETU22521 as outgroup) sequences amplified from infected chimpanzees and gorillas. Sequences are labelled as in Fig. 2(a). For each type found in both human and NHPs (A76, A89, A119 and D111), all available sequences >60 % complete in the VP1 region and >1 % divergent from each other were included in the sequence datasets.

