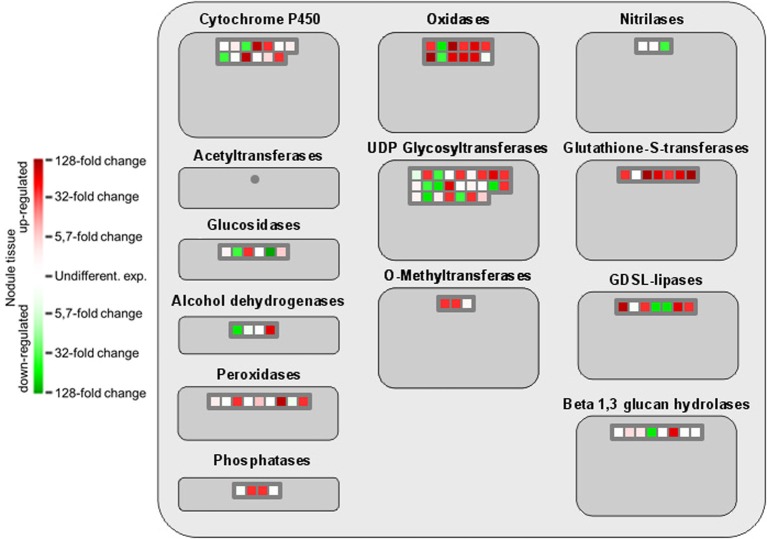
Figure 4.
MapMan-based classification of the expressed genes into large enzyme families. Each field represents the expression of a particular gene. Upregulated genes in nodule tissue are shown in red, genes with reduced expression in green, and undifferentially expressed ones in white. Dark gray fields indicate that none of the expressed genes could be assigned to the respective class.

