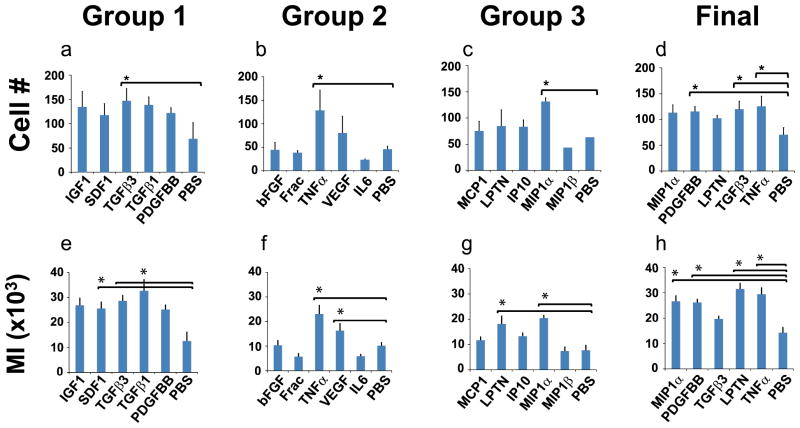
Figure 4.
Quantification of migrated cells and Migration Index (MI). a–d: The total number of migrated cells was quantified for the first three groups of cytotactic cues, and also for the final round of the most robust cues. Significantly more cells migrated than the control in response to TGFβ3 in Group 1, TNFα in Group 2, MIP1α in Group 3 and TNFα, TGFβ3, and PDGFbb in the final. e–h: The cell migration index was derived by multiplying the total number of cells migrated into the channel by the migratory distance. Significantly greater MI was induced than controls by SDF1 and TGFβ3 in Group 1, TNFα and VEGF in Group 2, LPTN and MIP1α Group 3 and MIP1α, PDGFbb, LPTN, and TNFα in the final. Values shown are means ± SE. *: p<0.05.

