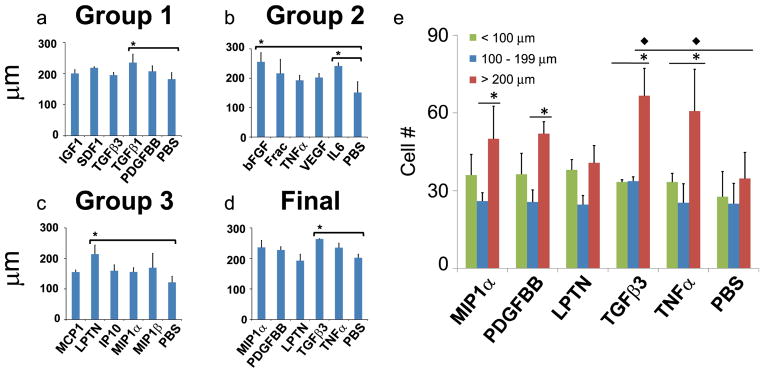
Figure 5.

Quantification of cell migration distance. a–d: Cells migrated significantly longer distances than controls in response to TGFβ1 in Group 1, bFGF and IL6 in Group 2, LPTN in Group 3, and TGFβ3 in the final. *: p<0.05. e: Cell migratory distances were stratified into categories of <100 μm, 100–200 μm and >200 μm. Values shown are means ± SE. * indicates significance (p<0.05) over other distances for a given one factor. ◆ indicates significance (p<0.05) of one factor over the control group for the same distance value. *: p<0.05.
