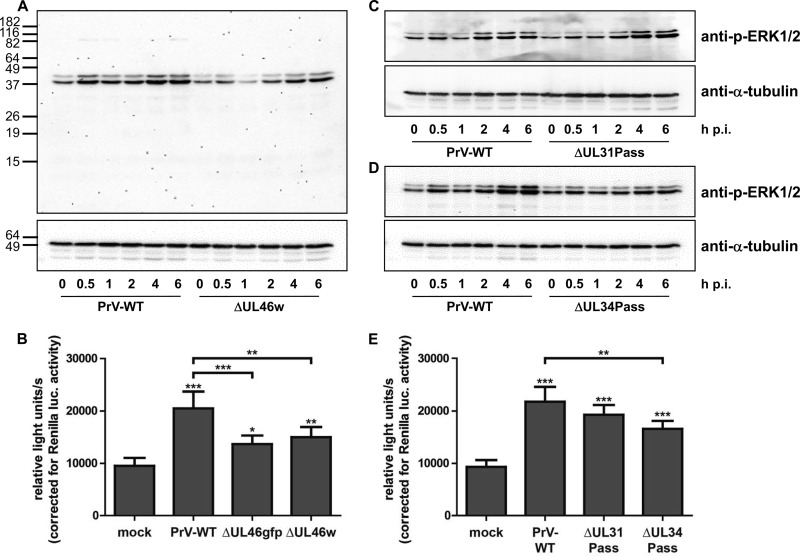
FIG 2.
Activation of the ERK1/2 signaling cascade. (A) RK13 cells were infected with wild-type PrV-Ka (WT) or PrV-ΔUL46w preparations in PBS at an MOI of 5 and harvested at times indicated. Cell lysates were separated on SDS-polyacrylamide gels (12%), blotted onto nitrocellulose membranes, and incubated with antisera as indicated on the right. Molecular masses of marker proteins (in kDa) are shown on the left. (B) RK13-SREluc cells were infected at an MOI of 3 for 7 h with wild-type PrV-Ka (WT), PrV-ΔUL46w, and PrV-ΔUL46gfp or mock infected. Cells were lysed, and firefly luciferase (as readout for Elk-1 activation) and Renilla luciferase activity was measured. Mean values and standard deviations of five independent experiments performed in duplicates are given. For statistical analysis, the repeated-measures ANOVA with a Tukey posttest was used (*, P < 0.05; **, P < 0.01; ***, P < 0.001). (C and D) RK13 cells were infected with wild-type PrV-Ka (C) and PrV-ΔUL31Pass (D) or with wild-type PrV-Ka (WT) and PrV-ΔUL34Pass at an MOI of 5. At times indicated, cells were harvested; cell lysates were separated on SDS-polyacrylamide gels (12%), blotted, and incubated with antisera as indicated. (E) RK13-SREluc cells were mock infected or infected with wild-type PrV, PrV-ΔUL31Pass, or PrV-ΔUL34Pass at an MOI of 3. At 7 h p.i., cells were lysed, and firefly luciferase activity (as readout for Elk-1 activation) and Renilla luciferase activity were measured. Mean values of six independent experiments performed in duplicates and the corresponding standard deviations are shown. For statistical analysis, the repeated-measures ANOVA and a Tukey posttest were used (*, P < 0.05; **, P < 0.01; ***, P < 0.001).

