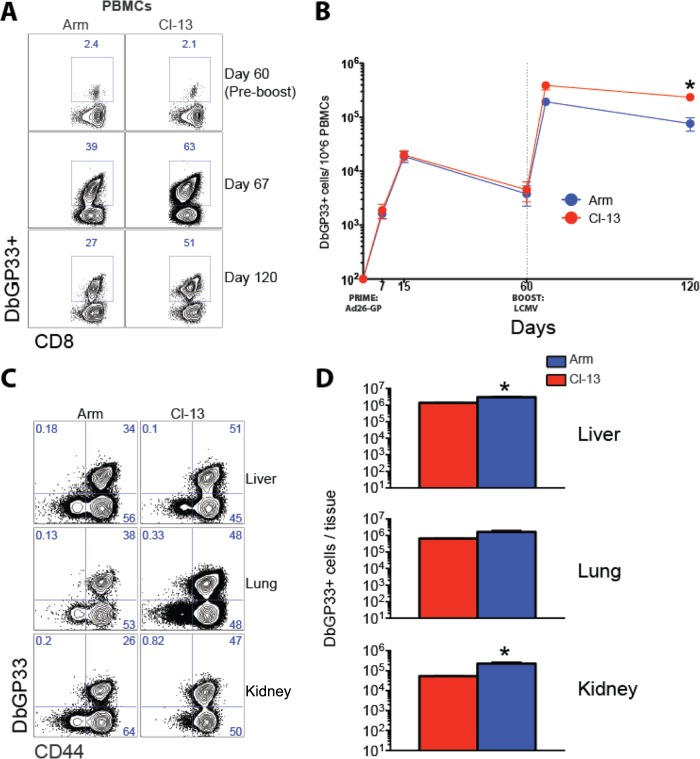
FIG 2.
Boosting with LCMV CL-13 results in increased magnitude of anamnestic CD8 T cell responses compared to boosting with LCMV Armstrong. (A) Representative fluorescence-activated cell sorting (FACS) plots showing the percentage of CD8 T cells in blood that were DbGP33+. PBMCs, peripheral blood mononuclear cells. (B) Summary of DbGP33 CD8 T cell responses in blood. (C) Representative FACS plots showing DbGP33+ responses in several tissues. (D) Numbers of DbGP33+ CD8 T cell responses in several tissues. Data are from day 60 LCMV boost. Error bars represent SEM. Data are from three experiments (four mice per group per experiment). Values that were statistically significant (P = 0.05) are indicated by an asterisk.

