FIG 3.
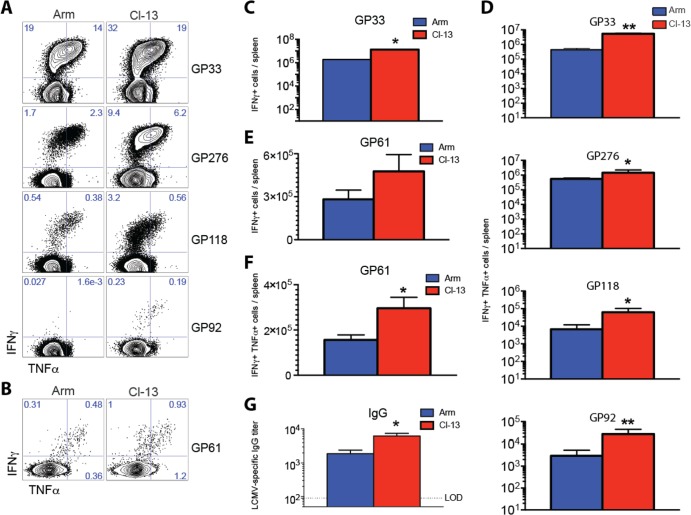
Boosting with LCMV CL-13 results in increased numbers of functional T cell responses and enhanced humoral responses compared to boosting with LCMV Armstrong. (A) Representative FACS plots showing the percentages of functional CD8 T cells in spleen that were specific for several GP-derived epitopes. (B) Representative FACS plots showing the percentages of functional CD4 T cells in spleen that were specific for GP61. (C) Numbers of functional GP33-specific CD8 T cells in spleen. (D) Numbers of several GP-specific CD8 T cell responses that coexpressed IFN-γ and TNF-α in spleen. (E) Numbers of functional GP61-specific CD4 T cells in spleen. (F) Numbers of functional GP61-specific CD4 T cell responses that coexpressed IFN-γ and TNF-α in spleen. (G) LCMV-specific antibody levels in sera at day 15 postboost (enzyme-linked immunosorbent assay [ELISA]). The dotted line represents the limit of detection (LOD). Prime immunizations were performed with Ad26-GP, and at day 60, mice were boosted with either LCMV Armstrong or LCMV CL-13. Data from panels A to F are from day 60 postboost following 5-h peptide stimulation. Error bars represent SEM. Data are from three experiments (four mice per group per experiment). Values that were statistically significant are indicated by asterisks as follows: *, P = 0.05; **, P = 0.02.

