
FIG 5.
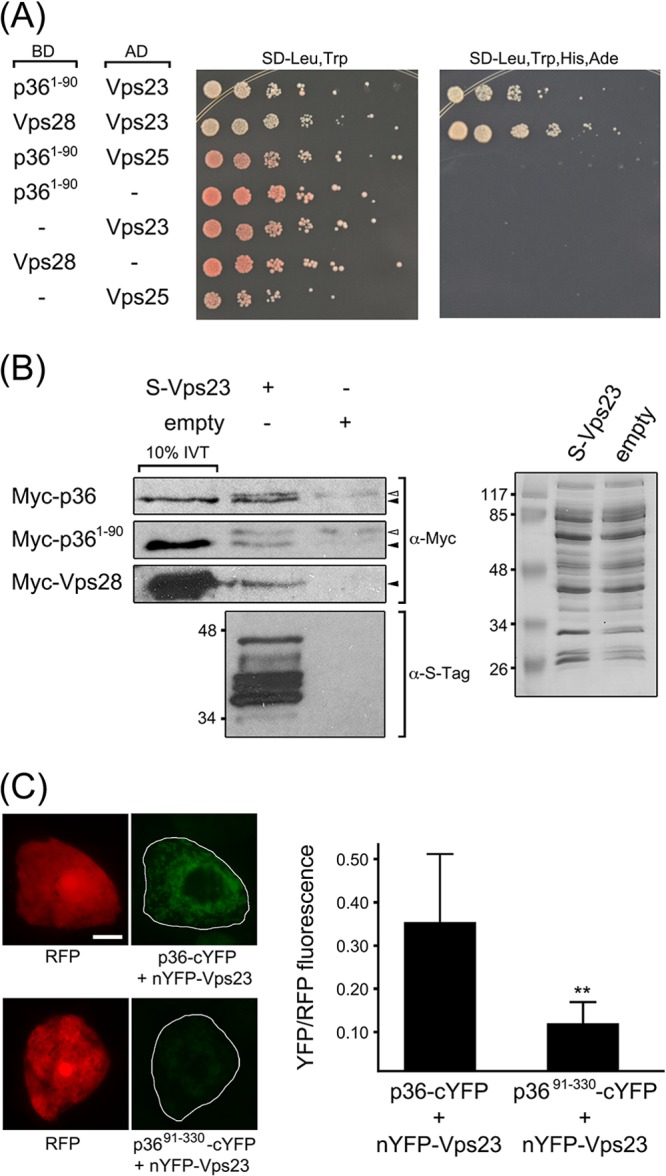
The N-terminal region of p36 interacts with Vps23. (A) p361-90 interacts with Vps23 in the yeast two-hybrid assay. Yeast strains were cotransformed with the indicated pairs of GAL4-binding domain (BD) and GAL4-activiating domain (AD) fusion proteins or the corresponding empty BD or AD control plasmids, denoted by a hyphen in the BD or AD column. Serial (1:5) dilutions of cells were spotted onto agar plates containing either low-stringency media (SD-Leu,Trp) or high-stringency media (SD-Leu,Trp,His,Ade), where cell growth is dependent on two-hybrid protein interactions. (B) In vitro coimmunoprecipitation of p36 or p361-90 and Vps23. Whole-cell lysates of E. coli transformed with S-Vps23 or the corresponding empty vector were incubated with S-protein agarose and in vitro-translated (IVT) full-length Myc-p36, Myc-p361-90, or Myc-Vps28, and washed. Eluted proteins (and 10% of the total IVT reaction mixture) were subjected to SDS-PAGE and protein blotting and then probed with either anti-Myc or anti-S-tag antibodies. The solid (black) arrowheads indicate the relative positions of specific immunodetected proteins; the open (white) arrowheads indicate nonspecific, immunodetected proteins. Note that the immunodetected proteins indicated by the solid arrowheads are not present in the coimmunoprecipitation reactions with lysates of E. coli containing empty vector. Shown to the right is a Coomassie blue-stained gel of total soluble protein from lysates containing S-Vps23 or empty vector prior to incubation with S-protein agarose, confirming equivalent input. The numbers to the left of the gels are the molecular masses (in kilodaltons) of protein standards. (C) Interaction of p36 and Vps23 in the BiFC assay. Representative epifluorescence micrographs of BY-2 cells triple transformed (as indicated) with RFP, nYFP-Vps23, and either p36-cYFP or p3691-330-cYFP. Relative RFP and YFP fluorescence values of transformed cells, which are delineated by the solid lines in the panels on the right were quantified using ImageJ (refer to Materials and Methods for details). Note the relatively low YFP fluorescence in the representative cell coexpressing the negative control, p3691-330-cYFP. At least 25 transformed cells were analyzed from at least three independent experiments, and the mean YFP-to-RFP ratios (plus standard deviation [SD]) are plotted in the bar graph on the right. The two asterisks denote a statistically significant difference between the two samples (P ≤ 0.001).