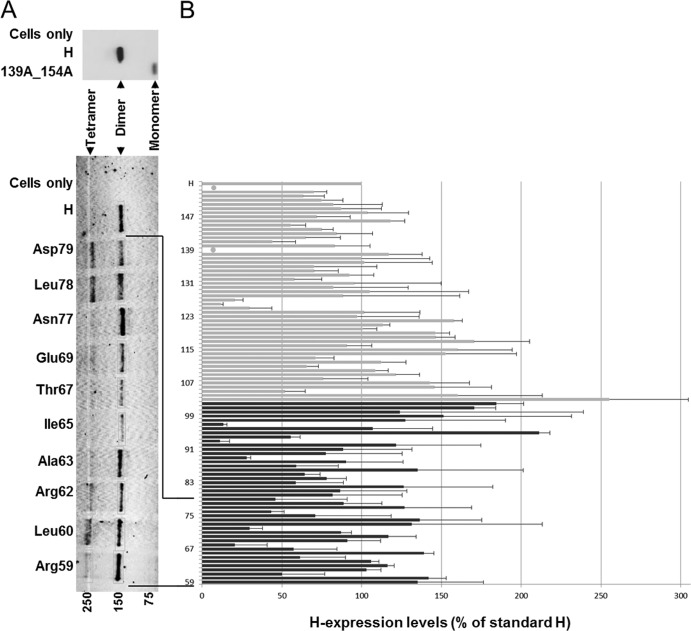
FIG 2.
Expression levels of H-stalk Cys mutants. (A, top gel) Standard H protein (H) and a mutant lacking both stalk Cys residues (139A_154A) separated on a nonreducing SDS-PAGE and immunoblotted. (Bottom gel) Cys mutants (as indicated) and standard H protein was extracted from cells in the presence of 50 mM iodoacetamide, separated on a nonreducing SDS-PAGE, and immunoblotted. Molecular mass markers are indicated at the bottom in kDa. The H monomer, dimer, and tetramer bands are indicated. (B) Total mutant H protein expression as a percentage of standard H. Total protein expression levels were determined by quantifying H dimer and, where present, H tetramer and H monomer protein band intensities using a Typhoon FLA laser scanner and ImageQuant TL software. Results represent the means from three experiments; standard deviations are indicated with error bars. Black bars, expression data for residues 59 to 102; gray bars, expression data for residues 103 to 154 (24). Native Cys at positions 139 and 154 are indicated by filled circles.

