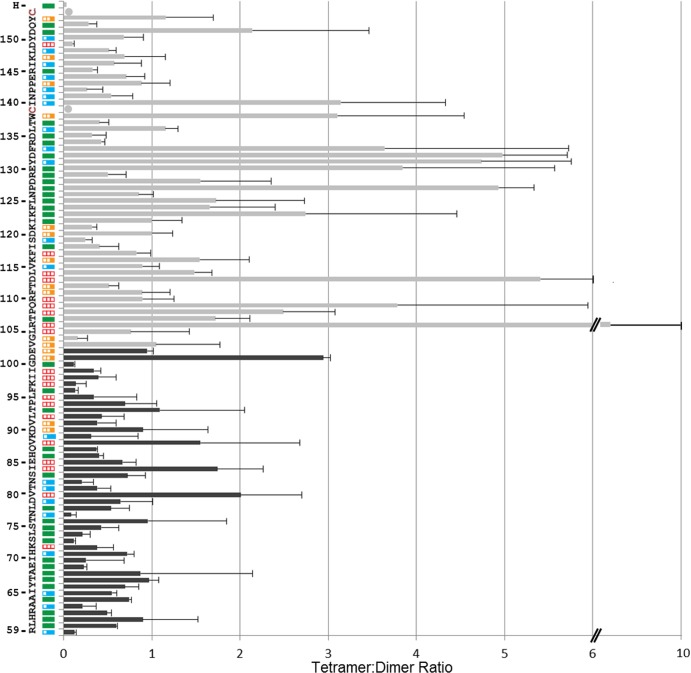
FIG 3.
Tetramer trapping propensity and fusion function of H-stalk mutants. The 96 residues (positions 59 to 154, bottom to top) of the H stalk are indicated on the left. Plasmids expressing Cys mutants for each residue were cotransfected in Vero cells with an F-expressing plasmid and a GFP-expressing plasmid. Fusion scores were determined 24 h posttransfection and are represented as colored boxes. Red empty box, fusion score of zero; one-third-filled orange box, fusion score of 1; two-thirds-filled blue box, fusion score of 2; full green box, fusion score of 3. Black or gray bars show tetramer-to-dimer ratios, calculated after loading the cell extracts on a nonreducing SDS-PAGE gel and quantifying the tetramer protein band and dimer protein band. Data for residues 59 to 102 are new (black bars), while data for residues 103 to 154 are from reference 24 (gray bars). Means and standard deviations from three experiments are indicated.

