
Figure 1.
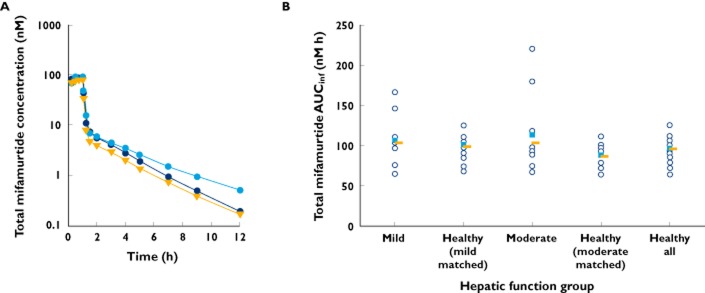
Mean plasma concentration–time profiles (A;  , mild;
  , moderate; and
  , healthy all) and individual (
 ), mean (
 ) and geometric mean values (
 ) of the area under the plasma concentration–time curve from time 0 to infinity (AUCinf; B) of total mifamurtide in subjects with mild or moderate hepatic impairment and in matched healthy subjects (‘healthy all’ represents the mean across all subjects in the two matched healthy subject groups)