
Figure 5.
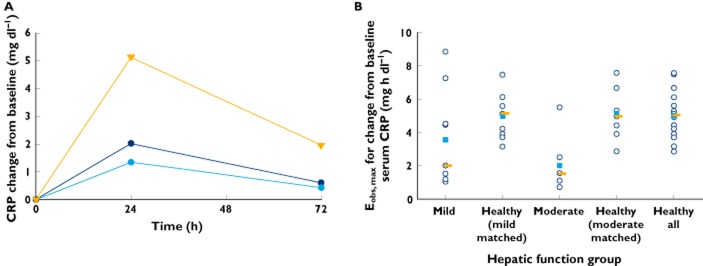
Time course of median change from baseline serum C-reactive protein (CRP; A;  , mild;
  , moderate; and
  , healthy all) and individual (
 ), mean (
 ) and median values (
 ) of observed maximal effect (Eobs,max) for change from baseline serum CRP (B) by hepatic function group