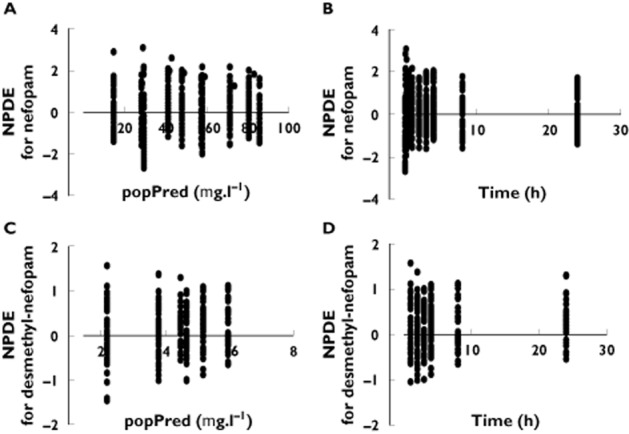
Figure 3.

Diagnostic plots. Normalized prediction distribution error (NPDE) as a function of population-predicted (popPred) concentrations of nefopam (A) and desmethyl-nefopam (C), and as a function of time for nefopam (B) and for desmethyl-nefopam (D)
