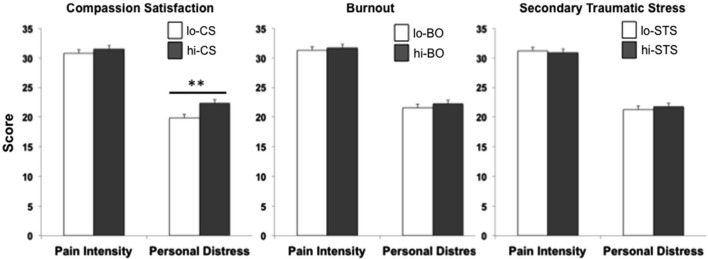
Figure 3.

The effect of professional quality of life. Comparison of lo- (white bar) and hi- (dark gray bar) participants for the three domains of professional quality of life. A significantly higher induced personal distress was found for hi-CS relative to lo-CS (*p < 0.01). Error bars are S.E.M.
