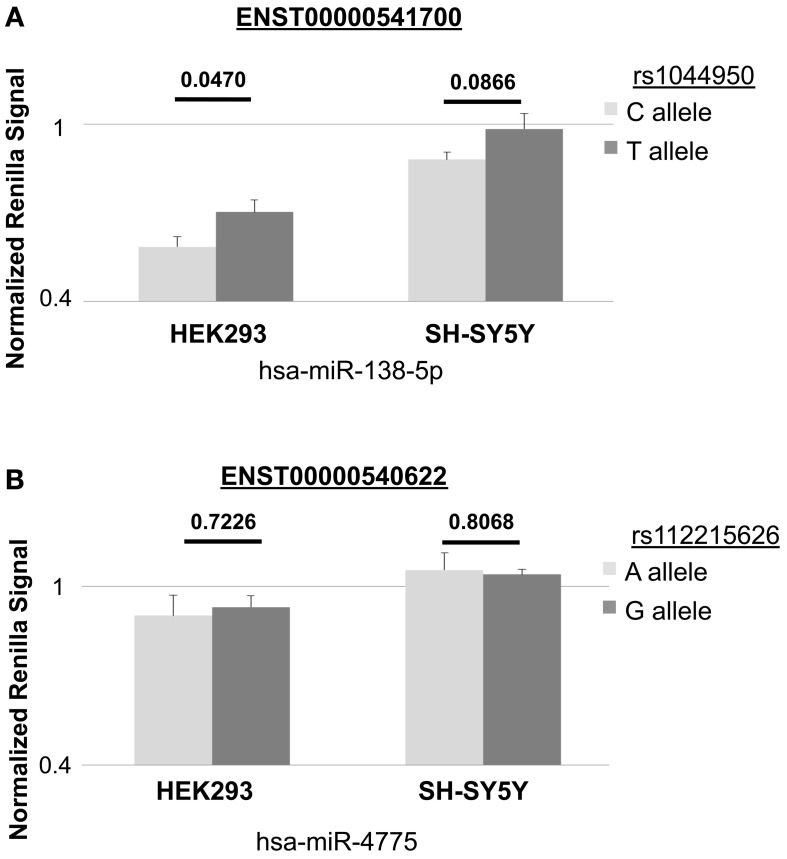
Figure 2.
In vitro effects of rs1044950 and rs112215262 on miRNA-to-mRNA binding and gene expression. The bar charts show the normalized Renilla luciferase expression in constructs containing DCP1B 3′UTR and corresponding SNP alleles. Depicted are the mean Renilla luciferase intensities and the standard errors relative to the control luciferase intensities of the construct co-transfected with the non-targeting miRNA control (corresponding to the horizontal line): (A) for transcript ENST00000541700 containing the reference (G) or alternative (A) allele of rs1044950 and co-transfected with has-miR-138-5p into HEK293 and SH-SY5Y cells. The relative mean luciferase luminescence of the construct containing the G and the A allele was 0.585 (±0.0335) and 0.703 (±0.0417) in HEK293 cells, and 0.880 (±0.0256) and 0.985 (±0.0513) in SH-SY5Y cells. (B) for transcript ENST00000540622 containing the reference (T) or alternative (C) allele of rs112215626 and co-transfected with hsa-miR-4775 into HEK293 and SH-SY5Y cells. The relative mean luciferase luminescence of the construct containing T and the C allele was 0.903 (±0.0692) and 0.931 (±0.0382) in HEK293 cells, and 1.056 (±0.0582) and 1.041 (±0.0185) in SH-SY5Y cells.

