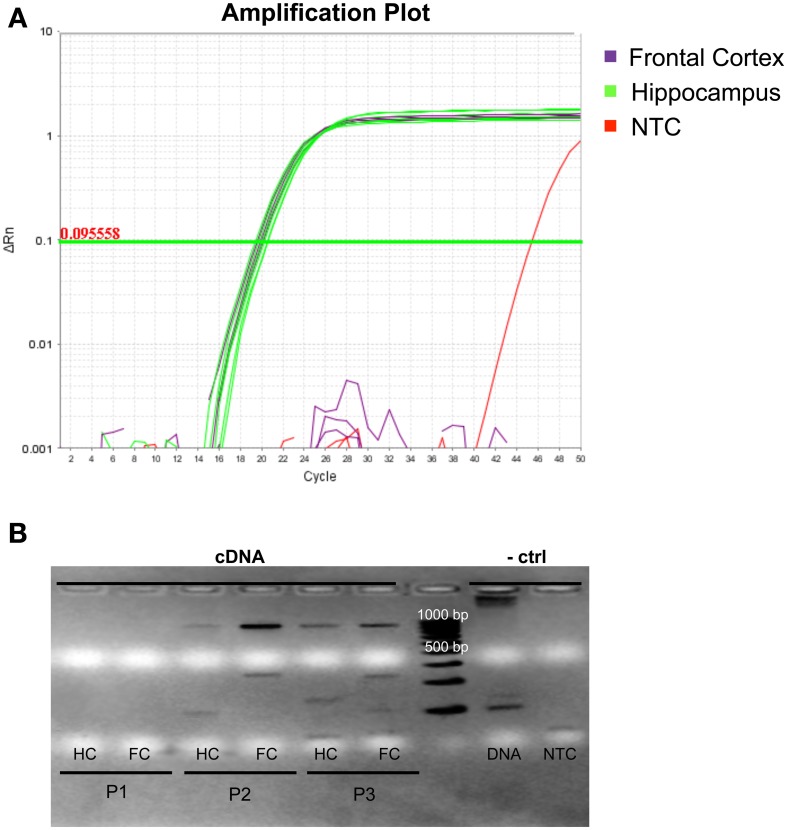
Figure 3.
Expression profile of hsa-miR-138-5p and DCP1B in autopsy brain tissues of three deceased human probands. (A) Amplification plot of qPCR experiments in three frontal cortices (highlighted in purple) and three hippocampi (highlighted in green). Hsa-miR-138-5p was expressed in both frontal cortex (FC) and hippocampus (HC; CT ~ 19). One of two NTCs (non-template control, highlighted in red) showed amplification at CT > 45, whereas the other NTC did not show any amplification. (B) Ethidium bromide stained gel electrophoresis in 1% agarose displays the semi-quantitative levels of DCP1B cDNA (expected and observed at ~850 bp) in post-mortem human brain tissues. No expression was detected in proband 1 (P1). The DCP1B cDNA levels were higher in the FC, compared to HC of proband 2 (P2) and proband 3 (P3). (A) gDNA amplicon band (expected and observed at ~6.9 kb) could be detected and no band in the NTC.

