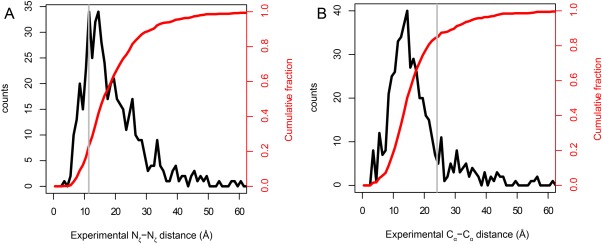
Figure 2.

Distances between crossed-linked atoms in XL-MS experiments using BS3 or DSS and proteins with known experimental structures. The data come from the compilation of Kahraman et al.30 Distributions (black) and cumulative distributions (red) are shown with 1-Å bins. The gray lines show the conventional cutoff distances of 11.4 Å for Nζ and 24.4 Å for Cα. The total number of crosslinks included in the data is 502. (A) Experimental Nζ–Nζ distances. Note that the central tendency of the Nζ–Nζ distances is considerably larger than the 11.4-Å span of the fully extended BS3 linker, and that the distribution has a heavy tail at larger distances. (B) Experimental Cα–Cα distances. The Cα–Cα distance distribution peaks at distances considerably lower than the maximum theoretical Cα–Cα distance (24 Å, see Fig. 1).
