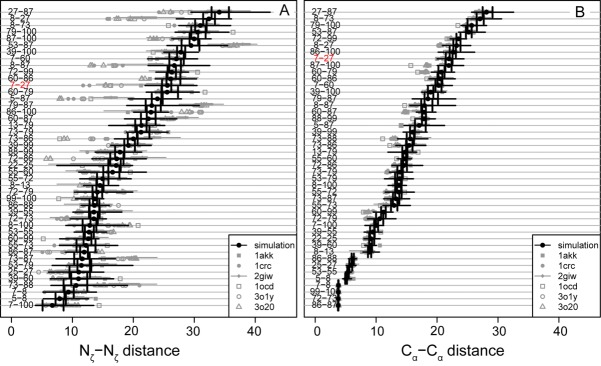
Figure 5.

Experimental and simulation lysine–lysine distances for residues reported to be crosslinked with BS3. (A) Nζ–Nζ data for cytochrome c from horse. (B) Cα–Cα data for cytochrome c from horse. Black circles, simulation median values; vertical black lines, first and third quartile distances; heavy gray line, maximum and minimum distances; gray symbols, experimental distances derived from x-ray crystallography or NMR spectroscopy from the structures indicated by PDB code in the legend. 1crc, 1hrc, 3o1y and 3o20, are crystal structures containing one, three, and three molecules in the asymmetric unit, respectively. 1giw, 2giw, 1akk, 2frc, and 1ocd are NMR structures. 2giw is an ensemble with 40 structures; the others are all single minimized average structures. Crosslinking data from28,31. Note that both the experimental and simulation ensembles are quite broad, and for most residues, there is substantial overlap between experiment and simulation. Many of the exceptions involve lysine 87, which is located in a flexible loop that undergoes a conformational change in conformation early in the simulation. In both A and B, the K7-K27 link, discussed in the text, is highlighted in red.
