
Figure 2.
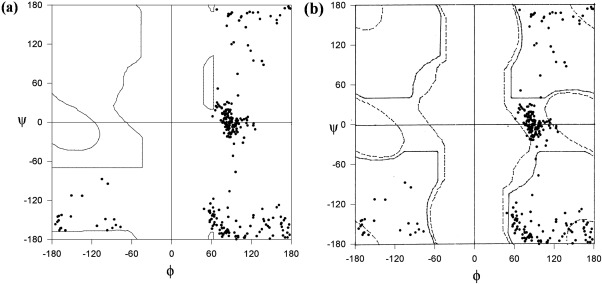
Plot of (φ, ψ) values of conserved Gly in homologous protein structures determined at ultrahigh resolution with the (φ, ψ) values allowed for glycyl residues superimposed on (a) Ala Ramachandran map and (b) Gly Ramachandran map (CategoryB). Solid and dashed lines in (b) show fully and partially allowed regions, respectively.