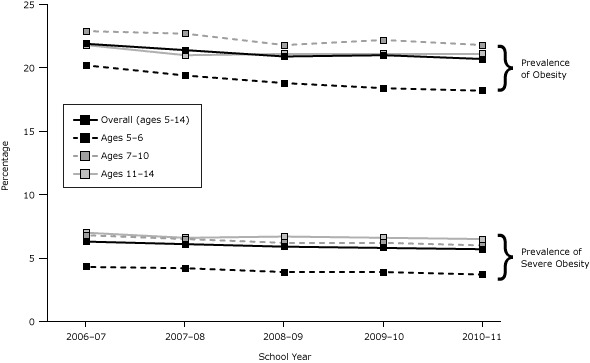
Figure 1.

Trends in prevalence by age group of severe obesity and obesity (which includes severe obesity) among NYC public school students aged 5 to 14 years in kindergarten through 8th grade, school years 2006–07 through 2010–11. To test for trend over school years, a multivariate model was built that included as covariates a linear term for trend, along with sex; age; race/ethnicity; school borough by district public health office (DPHO) neighborhoods (neighborhoods with low income and disproportionate rates of morbidity and mortality); free-meal status; place of birth; language spoken at home; and an interaction by age, sex, and race/ethnicity. School and student codes were used as cluster variables. All trends were significant at P <.001. Prevalence estimates of obesity (body mass index [BMI] ≥95th percentile) and severe obesity (BMI ≥120% of 95th percentile) are based on valid BMI measurements weighted by race/ethnicity, school borough by DPHO, free-meal status, grade, sex, age, and school type (elementary vs middle) to be representative of the enrollment population for each school year. Adjusted P value for trend = .04 for severe obesity among the 7 to 10 years age group.
| Age Group, y | Prevalence | School Year, % |
Trend for Time P value |
||||
|---|---|---|---|---|---|---|---|
| 2006–07 | 2007–08 | 2008–09 | 2009–10 | 2010–11 | |||
| Overall (ages 5–14) | Obesity | 21.90 | 21.40 | 20.90 | 21.00 | 20.70 | <.001 |
| Severe obesity | 6.30 | 6.10 | 5.90 | 5.80 | 5.70 | <.001 | |
| 5–6 | Obesity | 20.20 | 19.40 | 18.80 | 18.40 | 18.20 | <.001 |
| Severe obesity | 4.30 | 4.20 | 3.90 | 3.90 | 3.70 | <.001 | |
| 7–10 | Obesity | 22.90 | 22.70 | 21.80 | 22.20 | 21.80 | <.001 |
| Severe obesity | 6.80 | 6.50 | 6.20 | 6.20 | 6.00 | .04 | |
| 11–14 | Obesity | 21.80 | 21.00 | 21.10 | 21.10 | 21.10 | <.001 |
| Severe obesity | 7.00 | 6.60 | 6.70 | 6.60 | 6.50 | <.001 | |
