
Figure 2.
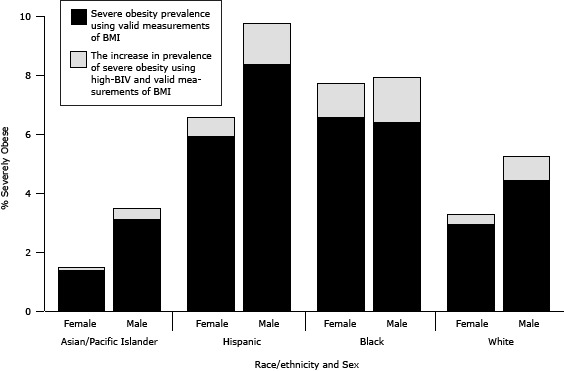
Potential effect of misclassification of plausible values as biologically implausible on severe obesity prevalence, by race/ethnicity and sex among New York City public school students, grades kindergarten through 8, 2010–11 school year. Prevalence estimates of severe obesity (body mass index [BMI] ≥120% of 95th percentile by age and sex) are based on measurements taken during the 2010–11 school year among students aged 5 to 14 years at the end of the school year. Measurements were weighted by race/ethnicity, school borough by district public health office neighborhoods (neighborhoods with low-income and disproportionate rates of morbidity and mortality), free-meal status, grade, sex, age, and school type (elementary vs middle) to be representative of the enrollment population for the 2010–11 school year. Students categorized as Asian/Pacific Islander, black, or white were all non-Hispanic. Persons categorized as Hispanic were of any race. Biologically implausible values (BIV) records are records identified as BIV for height, weight, weight-for-height, or BMI according to the age- and sex-specific Centers for Disease Control and Prevention's 2000 growth chart z scores (17) and the World Health Organization’s fixed exclusion range cut-offs (18), which were further classified into high-BIV if the student’s records showed a BMI at or greater than 120% of the 95th percentile. To quantify the upper boundary effect of misclassified BIVs on prevalence estimates of severe obesity, all high-BIV records were assumed to be misclassified as BIV for the 2010–11 school year. The high-BIV measurements were combined with the valid measurements of BMI; these combined records were reweighted (by using the procedures described above) to be representative of the enrollment population for the 2010–11 school year. Prevalence of severe obesity was recalculated including high-BIV records, and the reported percentages are the increase in prevalence observed from including high-BIV records. Abbreviation: BMI, body mass index.
| Race/Ethnicity | Sex | Severe Obesity Prevalence, % | Percentage Point Increase, Severe Obesity Prevalence |
|---|---|---|---|
| Asian/Pacific Islander | Female | 1.37 | 0.10 |
| Male | 3.09 | 0.40 | |
| Hispanic | Female | 5.90 | 0.65 |
| Male | 8.35 | 1.40 | |
| Black | Female | 6.55 | 1.15 |
| Male | 6.38 | 1.53 | |
| White | Female | 2.92 | 0.35 |
| Male | 4.42 | 0.81 |