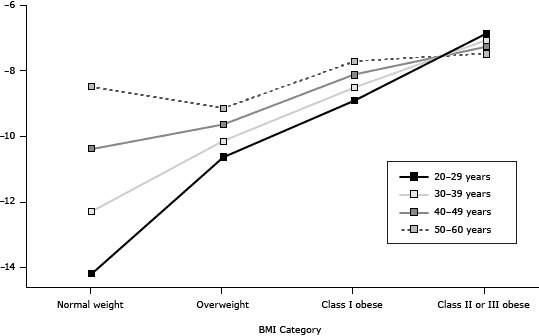
Figure.

Probability of receiving health care professional weight loss advice, by body mass index (BMI) and age, among male US firefighters in the Fuel 2 Fight study, 2011–2012. Model with interaction: ln=−3.99+1.55(Overweight)+3.14(Class I Obese)+4.32(Class II-III Obese)+0.19(Age)–0.14(Overweight×Age)–0.15(Class I Obese×Age)–0.21(Class II-III Obese×Age)+0.53(Comorbidities)+0.41(WA). Log odds are based on the mean for each age category.
| BMI Category/Age, y | Log Odds |
|---|---|
| Normal weight | |
| 20–29 | −14.16 |
| 30–39 | −12.26 |
| 40–49 | −10.36 |
| 50–60 | −8.46 |
| Overweight | |
| 20–29 | −10.61 |
| 30–39 | −10.11 |
| 40–49 | −9.61 |
| 50–60 | −9.11 |
| Class I obese | |
| 20–29 | −8.88 |
| 30–39 | −8.48 |
| 40–49 | −8.08 |
| 50–60 | −7.68 |
| Class II or III obese | |
| 20–29 | −6.84 |
| 30–39 | −7.04 |
| 40–49 | −7.24 |
| 50–60 | −7.44 |
