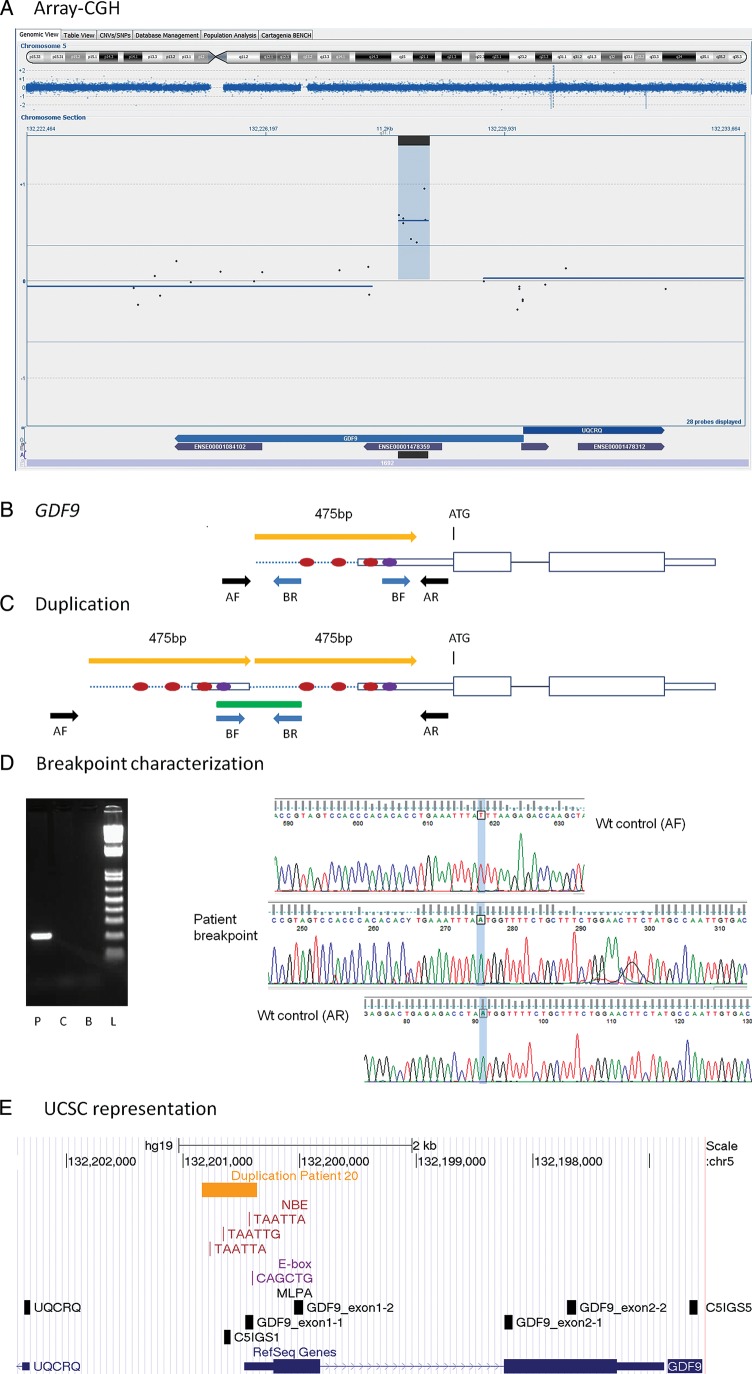
Figure 1.
GDF9 duplication. (A) Representation of an array-CGH result from the Cytosure software. The duplicated segment is indicated by blue background with a positive baseline offset. Blue dispersed dots represent oligomarkers. Blue arrows on bottom indicate gene location and purple smaller arrows represent exons. Black horizontal line on bottom represents location of duplication. Chromosome ideogram shown on top with the current segment magnification indicated by blue background color. (B) Schematic representation of the GDF9 gene. The ATG indicates the initiation of translation. Red dots represent NBE. Violet dot represents the E-box. Yellow arrow indicates the duplicated segment. Black and blue arrows represent PCR primers for wild-type allele (wt) and for duplication breakpoint amplification, respectively. (C) Schematic representation of the duplication. The green line represents the PCR product containing the duplication junction. (D) Breakpoint characterization. Gel image of amplified PCR breakpoint fragment. P, patient; C, control; B, blank; L, ladder. Electropherograms with sequence of the breakpoint (in the middle), partially aligned with the wt allele (upper and lower electropherograms). (E) Representation from the UCSC genome browser, GRCh37/hg19 assembly. Horizontal yellow arrow line indicates the duplicated segment. Locations of NBE (TAATTA, TAATTG) and E-box (CAGCTG) are shown as vertical red and purple lines, respectively. Vertical black boxes represent MLPA probes.

