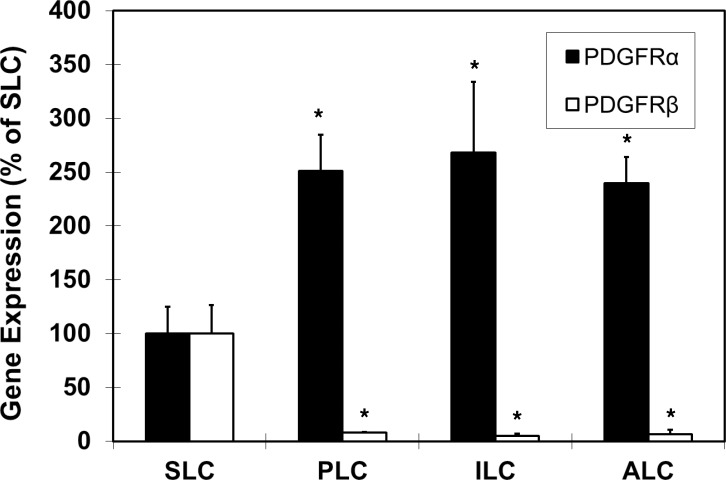
FIG. 1.
Microarray analysis showing gene expression levels of PDGFRα (black bars) and PDGFRβ (white bars) during Leydig cell differentiation from SLC through PLC, ILC, and ALC phases. The levels are expressed as percentages relative to SLC expression, with SLC expression normalized to 100%. Asterisks show significant differences relative to SLC expression of PDGFRα or PDGFRβ. Error bars are the mean (SEM).

