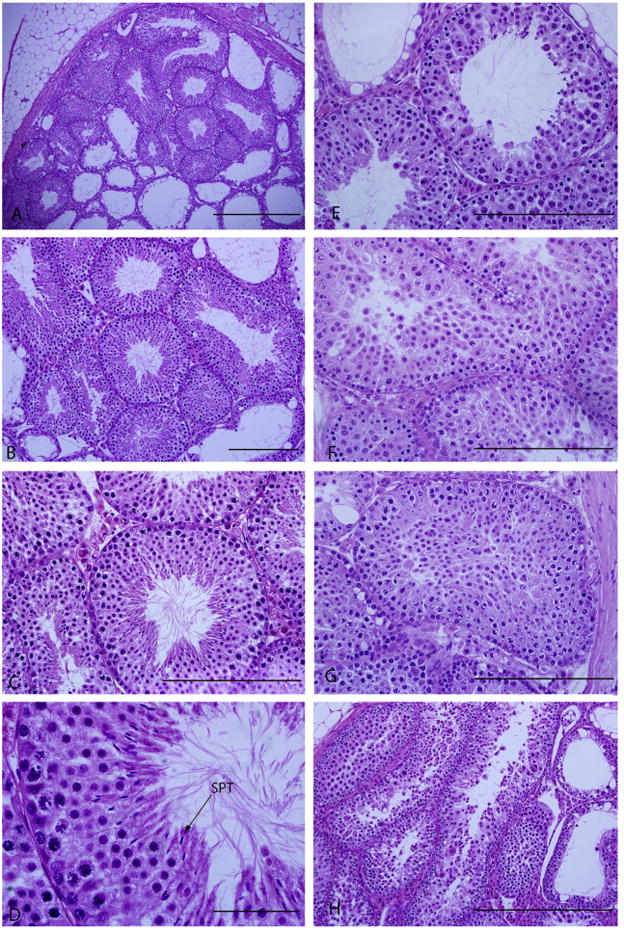
Fig. 3.

Morphology of fresh and frozen-thawed post-grafted testicular tissue. Magnification and scale bars for post-grafted fresh controls are A (×10–500 μm), B (×20–200 μm), C (×40–200 μm), D (× 100–50 μm), respectively. Magnification of E (DMSO), F (EG), G (PrOH), and H (glycerol) are ×40 and scale bars represent 200 μm, respectively. Arrow points spermatozoa (SPT).
