FIGURE 2.
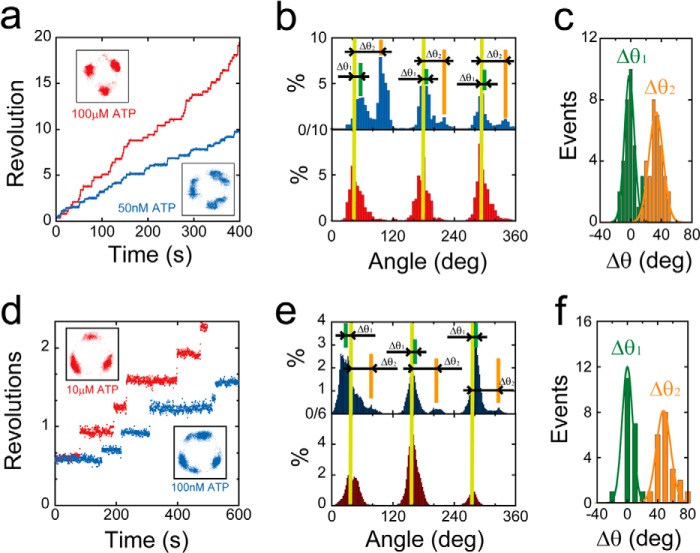
Stepping rotation of βGlu-190 mutants. a, examples of the time course of rotation by F1(βE190A). Buffer was exchanged during observation, and ATP concentration was reduced from 100 μm (red) to 50 nm (blue). The insets are x-y trajectories during rotation in the presence of 100 μm (left) or 50 nm ATP (right). b, histogram of the angular position of F1(βE190A) in the presence of 100 μm (bottom) or 50 nm ATP (top). Δθ1 and Δθ2 represent the angle distances of the pausing angles at 50 nm ATP compared with those at 100 μm ATP. c, distributions of angle distances of F1(βE190A) (Δθ1 and Δθ2). The average values of Δθ1 and Δθ2 are −1.8 ± 6.4 and 33 ± 9.2° (mean ± S.D., n = 33). d, examples of the time course of rotation by F1(βE190Q). Buffer was exchanged during observation, and ATP concentration was reduced from 10 μm (red) to 10 nm (blue). e, histogram of the angular position of F1(βE190Q) in the presence of 1 mm (bottom) or 1 nm ATP (top). Δθ1 and Δθ2 represent the angle distances of the pausing angles at 1 nm ATP from that at 1 mm ATP. f, distributions of angle distances of F1(βE190Q) (Δθ1 and Δθ2). The average values of Δθ1 and Δθ2 are 9.9 ± 10 and 54 ± 12° (mean ± S.D., n = 21).

