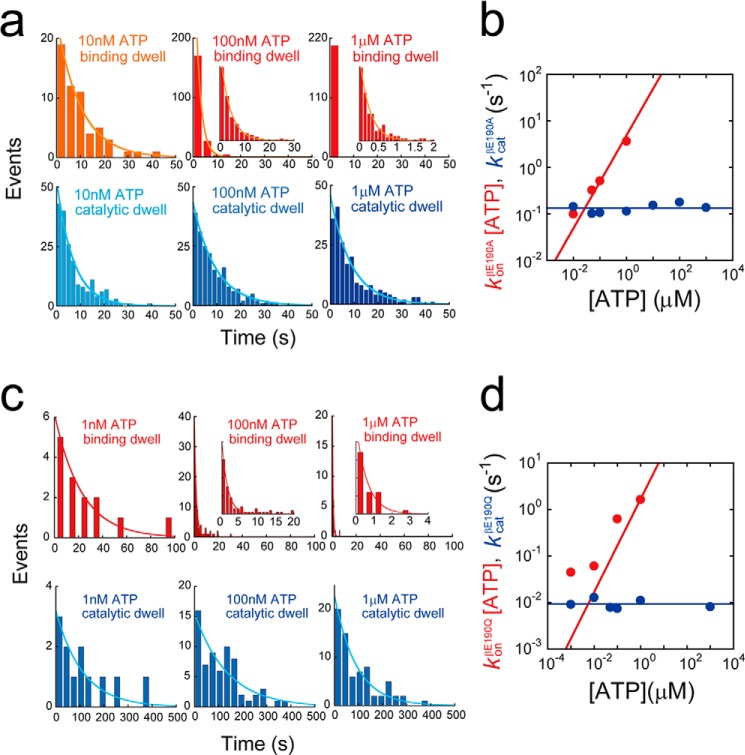
FIGURE 3.
Kinetic analysis of βGlu-190 mutants. a, histograms of the dwell time of F1(βE190A) at ATP binding angle (top) or catalytic angle (bottom) in the presence of 1 μm (right), 100 nm (middle), and 10 nm ATP (left). Curves represent the fittings with a single-order reaction scheme, y = C·exp(−kt). b, rate constants of ATP binding and catalysis of F1(βE190A) determined from a. Solid lines represent the linear fittings as follows: konβE190A = 4.9 × 10⁶ m−1 s−1, kcatβE190A = 0.13 s−1. c, histograms of the dwell time of F1(βE190Q) at ATP binding angle (top) or catalytic angle (bottom) in the presence of 1 μm (right), 100 nm (middle), and 1 nm ATP (left). Curves represent the fittings with a single-order reaction scheme, y = C·exp(−kt). d, rate constants of ATP binding and catalysis of F1(βE190Q) determined from c. Solid lines represent the linear fittings as follows: konβE190Q = 1.7 × 10⁶ m−1 s−1, kcatβE190Q = 9.3 × 10⁻³ s−1.

