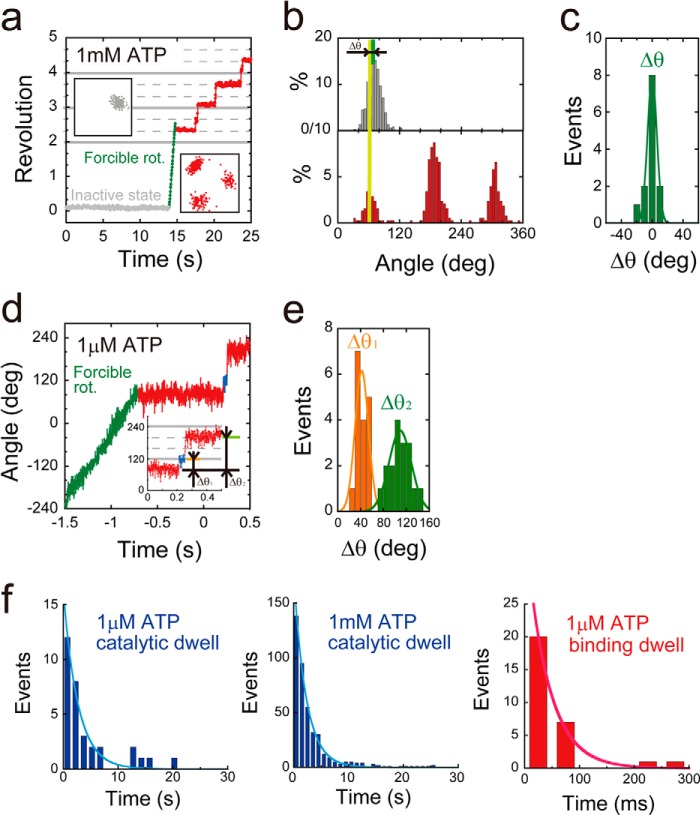
FIGURE 4.
Stepping rotation of αR364A mutant. a, examples of the time course of rotation by F1(αR364A). This variant lapsed into severe ADP inhibition (gray), and after forcible rotation with magnetic tweezers (green), it exhibited stepwise counterclockwise rotary motion (red). The insets are x-y trajectories during ADP inhibition (left) or stepwise rotation (right). b, histogram of the angular position during ADP inhibition (top) or stepwise rotation (bottom). Δθ represents the angle distance of the pausing angle at 1 mm ATP from that of ADP inhibition. c, distributions of angle distances (Δθ). The average value of Δθ was 0 ± 6.0° (mean ± S.D., n = 13). d, time course of the stepping rotation of F1(αR364A) in the presence of 1 μm ATP. Δθ1 represents the relative angular position of original pause at ATP saturating condition to ATP binding pause. Δθ2 represents the relative angular position of the original pauses. e, distributions of angle distances (Δθ1 and Δθ2). The average values of Δθ1 and Δθ2 are 42 ± 12 and 109 ± 28° (mean ± S.D., n = 36). f, histograms of the dwell time at catalytic angle (top) or ATP binding angle (bottom) in the presence of 1 mm (right) and 1 μm ATP (left). Curves represent the fittings with a single-order reaction scheme, y = C·exp(−kt). The rate constants of ATP binding and catalysis were determined as konαR364A = 2.4 × 10⁷ m−1 s−1, and kcatαR364A = 0.45 s−1.

